
Making Progress Monitoring Easier and More Motivating: Developing a Client Data Collection App Incorporating User-Centered Design and Behavioral Economics Insights

 ,
,
Abstract
:1. Introduction
Current Study
2. Materials and Methods
2.1. Setting and Context
2.2. Participants
2.3. Materials
2.4. Procedure
3. Results
3.1. App Improvement Idea Results
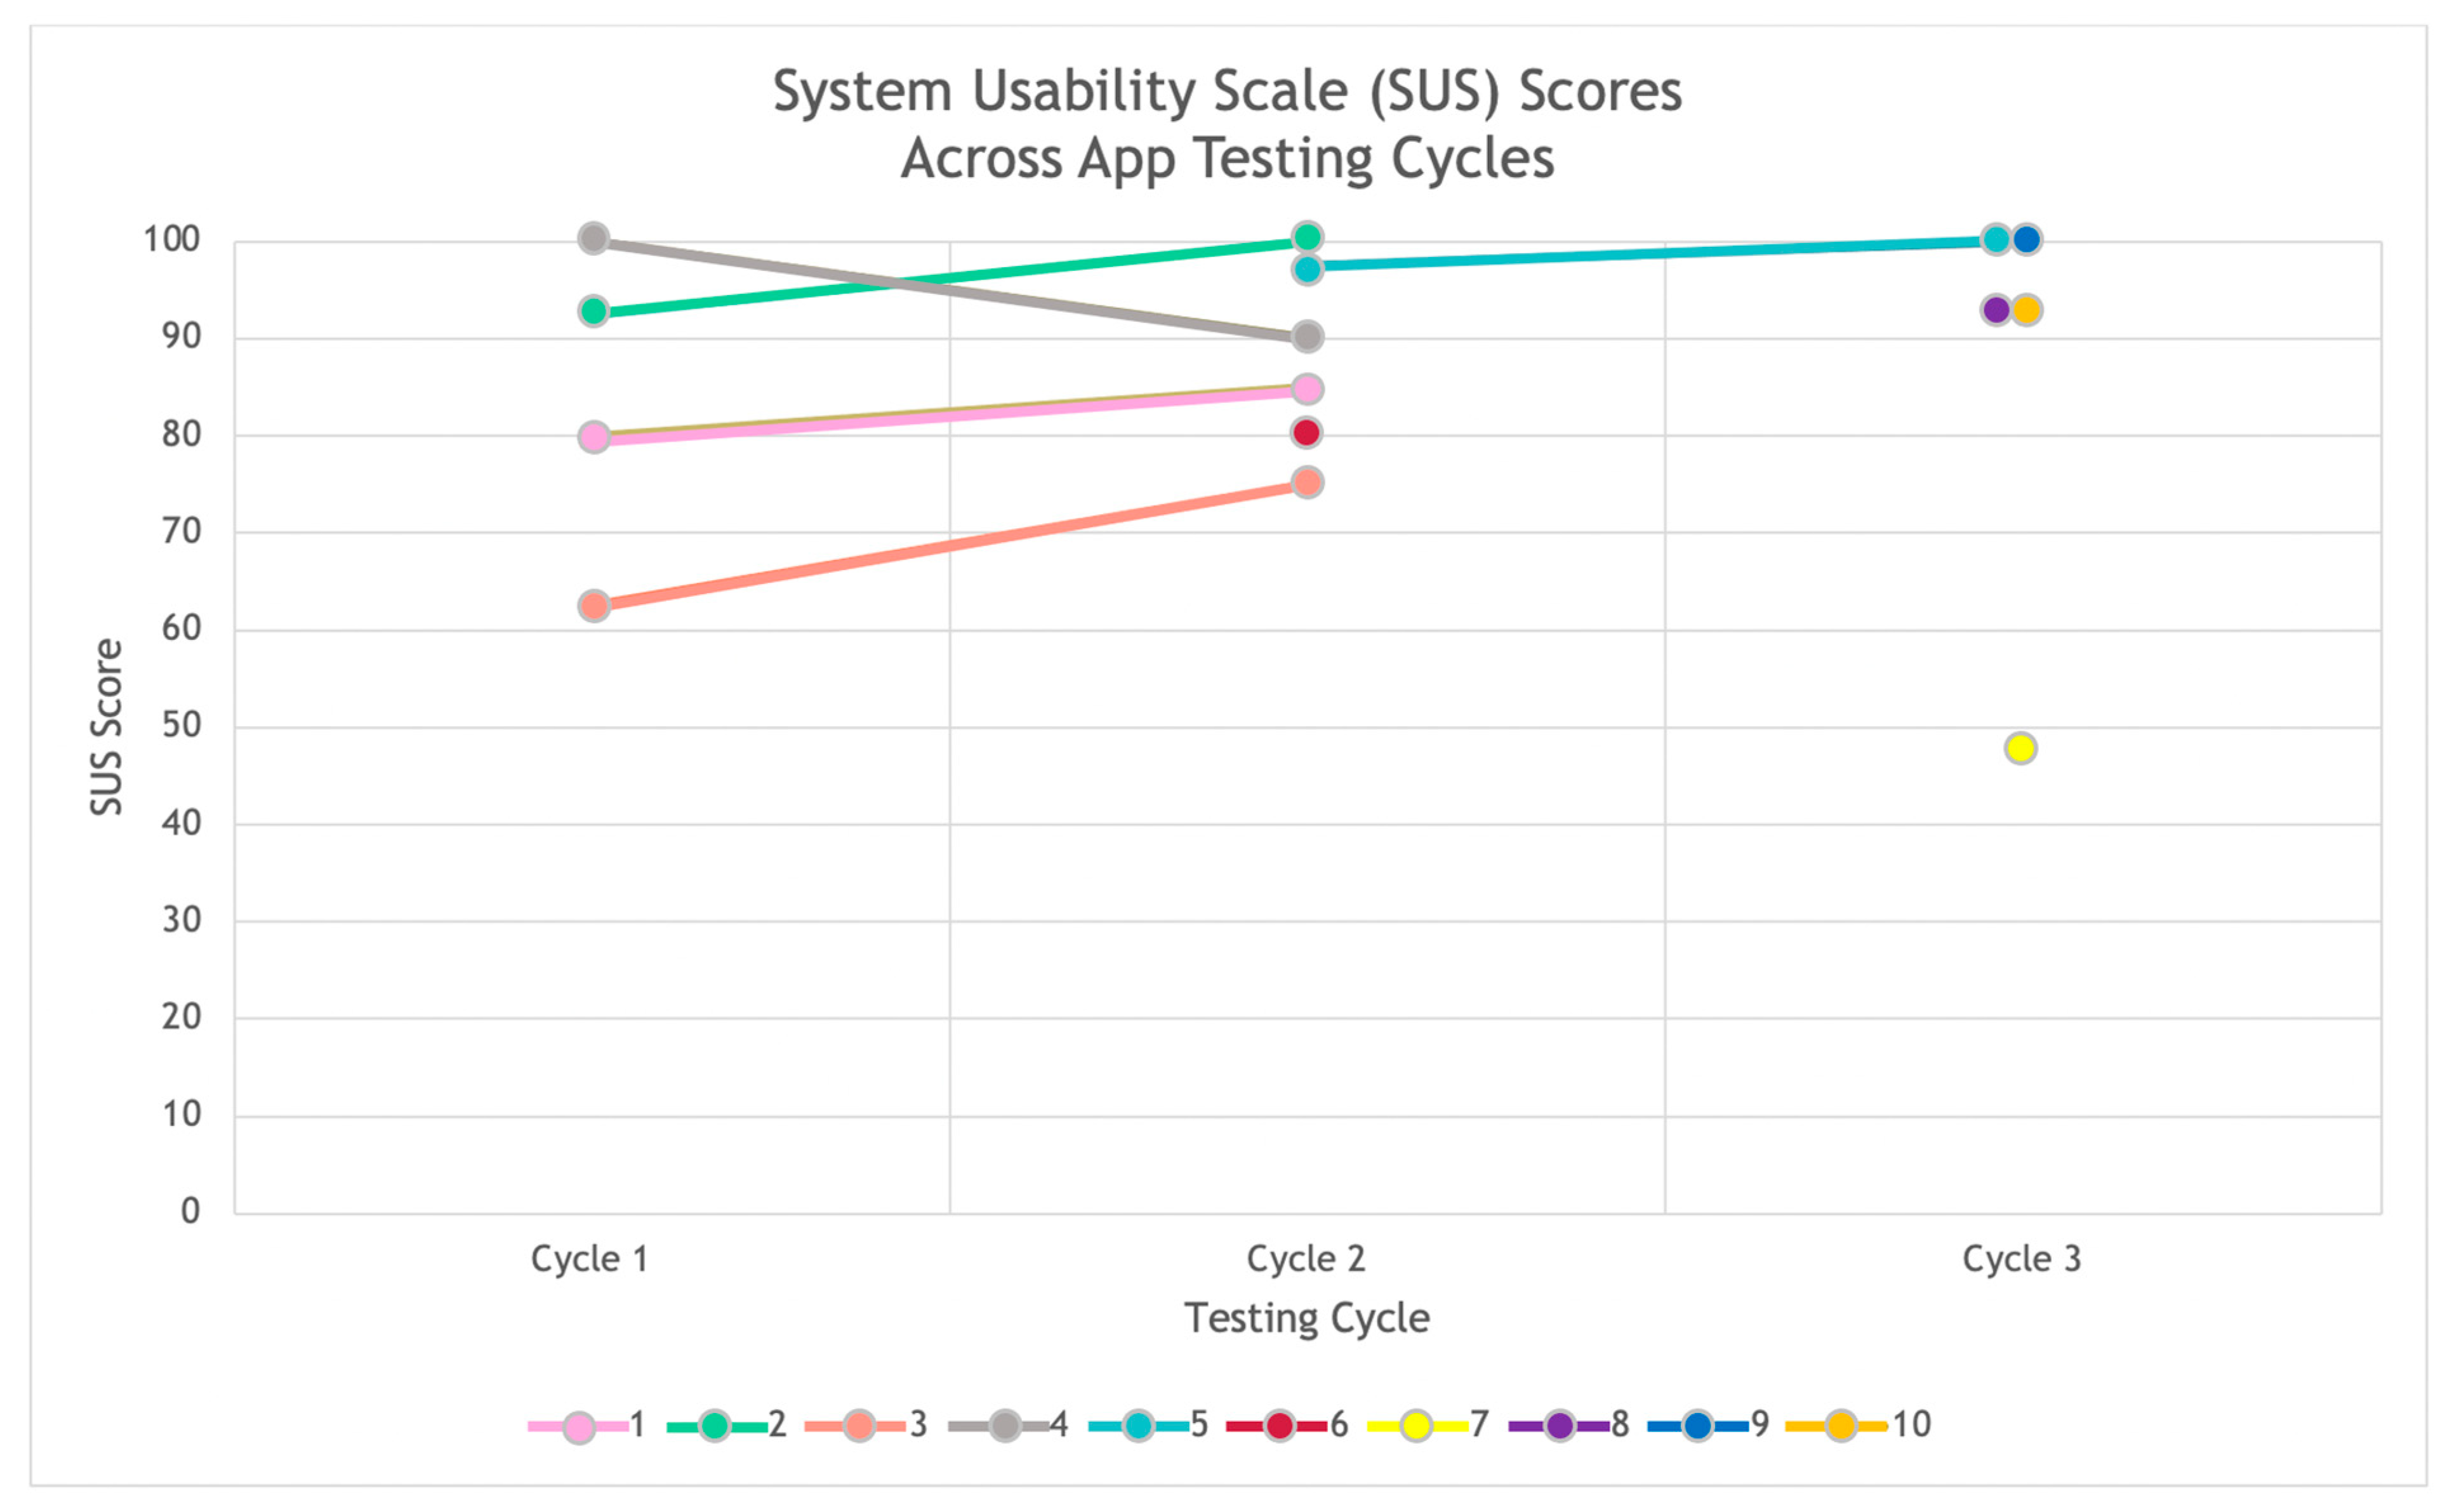
3.2. App Usability Results
4. Discussion
Limitations and Future Directions
Author Contributions
Funding
Institutional Review Board Statement
Informed Consent Statement
Data Availability Statement
Acknowledgments
Conflicts of Interest
References
- Penn Medicine Center for Health Care Innovation. About|Your Big Idea. n.d. Available online: https://bigidea.pennmedicine.org/about (accessed on 28 July 2021).
- Abras, Chadia, Diane Maloney-Krichmar, and Jenny Preece. 2004. User-centered design. In W. Bainbridge, Encyclopedia of Human-Computer Interaction. Thousand Oaks: Sage Publications, vol. 37, pp. 445–56. [Google Scholar]
- Bangor, Aaron, Phillip T. Kortum, and James T. Miller. 2008. An Empirical Evaluation of the System Usability Scale. International Journal of Human–Computer Interaction 24: 574–94. [Google Scholar] [CrossRef]
- Beidas, Rinad S., Kevin G. Volpp, Alison N. Buttenheim, Steven C. Marcus, Mark Olfson, Melanie Pellecchia, Rebecca E. Stewart, Nathaniel J. Williams, Emily M. Becker-Haimes, Molly Candon, and et al. 2019. Transforming Mental Health Delivery through Behavioral Economics and Implementation Science: Protocol for Three Exploratory Projects. JMIR Research Protocols 8: e12121. [Google Scholar] [CrossRef] [PubMed]
- Brooke, John. 1996. SUS: A “Quick and Dirty” Usability Scale. In Usability Evaluation In Industry. Boca Raton: CRC Press. [Google Scholar]
- Case, Meredith A., Holland A. Burwick, Kevin G. Volpp, and Mitesh S. Patel. 2015. Accuracy of Smartphone Applications and Wearable Devices for Tracking Physical Activity Data. JAMA 313: 625. [Google Scholar] [CrossRef] [Green Version]
- Cohen, Ira L., Helen J. Yoo, Matthew S. Goodwin, and Lauren Moskowitz. 2011. Assessing challenging behaviors in Autism Spectrum Disorders: Prevalence, rating scales, and autonomic indicators. In International Handbook of Autism and Pervasive Developmental Disorders. Berlin/Heidelberg: Springer, pp. 247–70. Available online: http://link.springer.com/chapter/10.1007/978-1-4419-8065-6_15 (accessed on 1 September 2021).
- Cotton, Victor, and Mitesh S. Patel. 2019. Gamification Use and Design in Popular Health and Fitness Mobile Applications. American Journal of Health Promotion 33: 448–51. [Google Scholar] [CrossRef] [PubMed]
- Dale, Oystein, and Kaare Birger Hagen. 2007. Despite technical problems personal digital assistants outperform pen and paper when collecting patient diary data. Journal of Clinical Epidemiology 60: 8–17. [Google Scholar] [CrossRef]
- Dopp, Alex R., Kathryn E. Parisi, Sean A. Munson, and Aaron R. Lyon. 2019. A glossary of user-centered design strategies for implementation experts. Translational Behavioral Medicine 9: 1057–64. [Google Scholar] [CrossRef] [PubMed] [Green Version]
- The Behavioural Insights Team. EAST: Four Simple Ways to Apply Behavioural Insights. n.d. Available online: https://www.bi.team/publications/east-four-simple-ways-to-apply-behavioural-insights/ (accessed on 24 May 2021).
- Goldsmith, Tina R., and Linda A. LeBlanc. 2004. Use of technology in interventions for children with autism. Journal of Early and Intensive Behavior Intervention 1: 166. [Google Scholar] [CrossRef] [Green Version]
- Hastings, Richard P., and Tony Brown. 2002. Coping strategies and the impact of challenging behaviors on special educators’ burnout. Mental Retardation 40: 148–56. [Google Scholar] [CrossRef]
- Hunt, Dereck L., R. Brian Haynes, Steven E. Hanna, and Kristina Smith. 1998. Effects of computer-based clinical decision support systems on physician performance and patient outcomes: A systematic review. JAMA 280: 1339–46. [Google Scholar] [CrossRef] [PubMed]
- Iadarola, Suzannah, Susan Hetherington, Christopher Clinton, Michelle Dean, Erica Reisinger, Linh Huynh, Jill Locke, Kelly Conn, Sara Heinert, Sheryl Kataoka, and et al. 2015. Services for children with autism spectrum disorder in three, large urban school districts: Perspectives of parents and educators. Autism 19: 694–703. [Google Scholar] [CrossRef] [PubMed] [Green Version]
- Jabbar, Huriya. 2011. The Behavioral Economics of Education: New Directions for Research. Educational Researcher 40: 446–53. [Google Scholar] [CrossRef]
- Jaspers, Monique W. M., Thiemo Steen, Cor Van Den Bos, and Maud Geenen. 2004. The think aloud method: A guide to user interface design. International Journal of Medical Informatics 73: 781–95. [Google Scholar] [CrossRef] [PubMed]
- Kientz, Julie A., Matthew S. Goodwin, Gillian R. Hayes, and Gregory D. Abowd. 2013. Interactive Technologies for Autism. Synthesis Lectures on Assistive, Rehabilitative, and Health-Preserving Technologies 2: 1–177. [Google Scholar] [CrossRef]
- Kim, Rebecca H., and Mitesh S. Patel. 2018. Barriers and Opportunities for Using Wearable Devices to Increase Physical Activity among Veterans: Pilot Study. JMIR Formative Research 2: e10945. [Google Scholar] [CrossRef] [PubMed]
- Koch, Alexander, Julia Nafziger, and Helena Skyt Nielsen. 2015. Behavioral economics of education. Journal of Economic Behavior & Organization 115: 3–17. [Google Scholar] [CrossRef] [Green Version]
- Langley, Audra K., Erum Nadeem, Sheryl H. Kataoka, Bradley D. Stein, and Lisa H. Jaycox. 2010. Evidence-based mental health programs in schools: Barriers and facilitators of successful implementation. School Mental Health 2: 105–13. [Google Scholar] [CrossRef] [PubMed] [Green Version]
- Lavecchia, Adam M., Heidi Liu, and Philip Oreopoulos. 2016. Chapter 1—Behavioral Economics of Education: Progress and Possibilities. In Handbook of the Economics of Education. Edited by Erik A. Hanushek, Stephen J. Machin and Ludger Woessmann. Amsterdam: Elsevier, vol. 5, pp. 1–74. [Google Scholar] [CrossRef]
- Le Jeannic, Anais, Celine Quelen, Corinne Alberti, and Isabelle Durand-Zaleski. 2014. Comparison of two data collection processes in clinical studies: Electronic and paper case report forms. BMC Medical Research Methodology 14: 7. [Google Scholar] [CrossRef] [PubMed] [Green Version]
- Levitt, Steven D., John A. List, Susanne Neckermann, and Sally Sadoff. 2016. The Behavioralist Goes to School: Leveraging Behavioral Economics to Improve Educational Performance. American Economic Journal: Economic Policy 8: 183–219. [Google Scholar] [CrossRef] [Green Version]
- List, John A., Anya Samek, and Dana L. Suskind. 2018. Combining behavioral economics and field experiments to reimagine early childhood education. Behavioural Public Policy 2: 1–21. [Google Scholar] [CrossRef] [Green Version]
- Marcu, Gabriela, Kevin Tassini, Quintin Carlson, Jillian Goodwyn, Gabrielle Rivkin, Kevin J. Schaefer, Anind K. Dey, and Sara Kiesler. 2013. Why do they still use paper? Understanding data collection and use in Autism education. Paper presented at CHI’13, SIGCHI Conference on Human Factors in Computing Systems, Paris, France, April 27–May 2; pp. 3177–86. [Google Scholar] [CrossRef]
- Melamed, Yuval, Henry Szor, and Elizur Bernstein. 2001. The loneliness of the therapist in the public outpatient clinic. Journal of Contemporary Psychotherapy 31: 103–12. [Google Scholar] [CrossRef]
- Mullainathan, Sendhil, and Richard H. Thaler. 2000. Behavioral Economics. (No. w7948). Cambridge: National Bureau of Economic Research. [Google Scholar] [CrossRef]
- Nuske, Heather J., and David S. Mandell. 2021. Digital health should augment (not replace) autism treatment providers. Autism 25: 1825–1847. [Google Scholar] [CrossRef] [PubMed]
- Patel, Mitesh S., Daniel Polsky, Edward H. Kennedy, Dylan S. Small, Chalanda N. Evans, Charles A. L. Rareshide, and Kevin G. Volpp. 2020. Smartphones vs. Wearable Devices for Remotely Monitoring Physical Activity After Hospital Discharge: A Secondary Analysis of a Randomized Clinical Trial. JAMA Network Open 3: e1920677. [Google Scholar] [CrossRef] [PubMed] [Green Version]
- Patel, Mitesh S., Luca Foschini, Gregory W. Kurtzman, Jingsan Zhu, Wenli Wang, Charles A. L. Rareshide, and Susan M. Zbikowski. 2017. Using Wearable Devices and Smartphones to Track Physical Activity: Initial Activation, Sustained Use, and Step Counts Across Sociodemographic Characteristics in a National Sample. Annals of Internal Medicine 167: 755–57. [Google Scholar] [CrossRef] [PubMed]
- Pellecchia, Melanie, David S. Mandell, Heather J. Nuske, Gazi Azad, Courtney Benjamin Wolk, Brenna B. Maddox, Erica M. Reisinger, Laura C. Skriner, Danielle R. Adams, Rebecca Stewart, and et al. 2018. Community–academic partnerships in implementation research. Journal of Community Psychology 46: 941–52. [Google Scholar] [CrossRef]
- Potthoff, Sebastian, Justin Presseau, Falko F. Sniehotta, Matthew Breckons, Amy Rylance, and Leah Avery. 2019. Exploring the role of competing demands and routines during the implementation of a self-management tool for type 2 diabetes: A theory-based qualitative interview study. BMC Medical Informatics and Decision Making 19: 23. [Google Scholar] [CrossRef]
- Raney, Lori, David Bergman, John Torous, and Michael Hasselberg. 2017. Digitally Driven Integrated Primary Care and Behavioral Health: How Technology Can Expand Access to Effective Treatment. Current Psychiatry Reports 19: 86. [Google Scholar] [CrossRef]
- Riggleman, Samantha. 2021. Using Data Collection Applications in Early Childhood Settings to Support Behavior Change. Journal of Special Education Technology 36: 175–82. [Google Scholar] [CrossRef]
- Rispoli, Mandy, Leslie Neely, Russell Lang, and Jennifer Ganz. 2011. Training paraprofessionals to implement interventions for people autism spectrum disorders: A systematic review. Developmental Neurorehabilitation 14: 378–88. [Google Scholar] [CrossRef]
- Saleem, Jason J., Emily S. Patterson, Laura Militello, Marta L. Render, Greg Orshansky, and Steven M. Asch. 2005. Exploring Barriers and Facilitators to the Use of Computerized Clinical Reminders. Journal of the American Medical Informatics Association 12: 438–47. [Google Scholar] [CrossRef] [Green Version]
- Saleem, Jason J., Emily S. Patterson, Laura Militello, Shilo Anders, Mercedes Falciglia, Jennifer A. Wissman, Emilie M. Roth, and Steven M. Asch. 2007. Impact of Clinical Reminder Redesign on Learnability, Efficiency, Usability, and Workload for Ambulatory Clinic Nurses. Journal of the American Medical Informatics Association 14: 632–40. [Google Scholar] [CrossRef] [Green Version]
- Samson, Alain. 2014. The Behavioral Economics Guide 2014. London: Behavioral Economics Group. [Google Scholar]
- Steinbrenner, Jessica R., Kara Hume, Samuel L. Odom, Kristi L. Morin, Sallie W. Nowell, Brianne Tomaszewski, Susan Szendrey, Nancy S. McIntyre, Serife Yücesoy-Özkan, and Melissa N. Savage. 2020. Evidence-Based Practices for Children, Youth, and Young Adults with Autism. Chapel Hill: The University of North Carolina, Frank Porter Graham Child Development Institute, National Clearinghouse on Autism Evidence and Practice Review Team. [Google Scholar]
- Stewart, Rebecca E., Nathaniel Williams, Y. Vivian Byeon, Alison Buttenheim, Sriram Sridharan, Kelly Zentgraf, David T. Jones, Katelin Hoskins, Molly Candon, and Rinad S. Beidas. 2019. The clinician crowdsourcing challenge: Using participatory design to seed implementation strategies. Implementation Science 14: 1–8. [Google Scholar] [CrossRef] [PubMed]
- Sutherland, Rebecca, David Trembath, and Jacqueline Roberts. 2018. Telehealth and autism: A systematic search and review of the literature. International Journal of Speech-Language Pathology 20: 324–36. [Google Scholar] [CrossRef] [PubMed]
- Terwiesch, Christian, and Karl T. Ulrich. 2009. Innovation Tournaments: Creating and Selecting Exceptional Opportunities. Boston: Harvard Business Press. [Google Scholar]
- Vashitz, Geva, Joachim Meyer, and Harel Gilutz. 2007. General Practitioners’ Adherence with Clinical Reminders for Secondary Prevention of Dyslipidemia. AMIA Annual Symposium Proceedings 2007: 766–70. [Google Scholar]


| Interviews (n = 16) | App Testing Cycles (n = 10) | |
|---|---|---|
| Race | ||
| Black or African American | 7 | 7 |
| White | 5 | 1 |
| Asian | 1 | 0 |
| Native Hawaiian or Pacific Islander | 1 | 0 |
| Prefer not to disclose | 0 | 2 |
| Other | 1 | 0 |
| Missing | 1 | 0 |
| Hispanic or Latino/a/x | ||
| No | 11 | 7 |
| Yes | 3 | 1 |
| Prefer not to disclose | 0 | 2 |
| Missing | 2 | 0 |
| Gender | ||
| Female | 10 | 8 |
| Male | 5 | 0 |
| Prefer not to disclose | 0 | 2 |
| Missing | 1 | 0 |
| App Tile * | Basic Data Collection Features | Behavioral Economics Features |
|---|---|---|
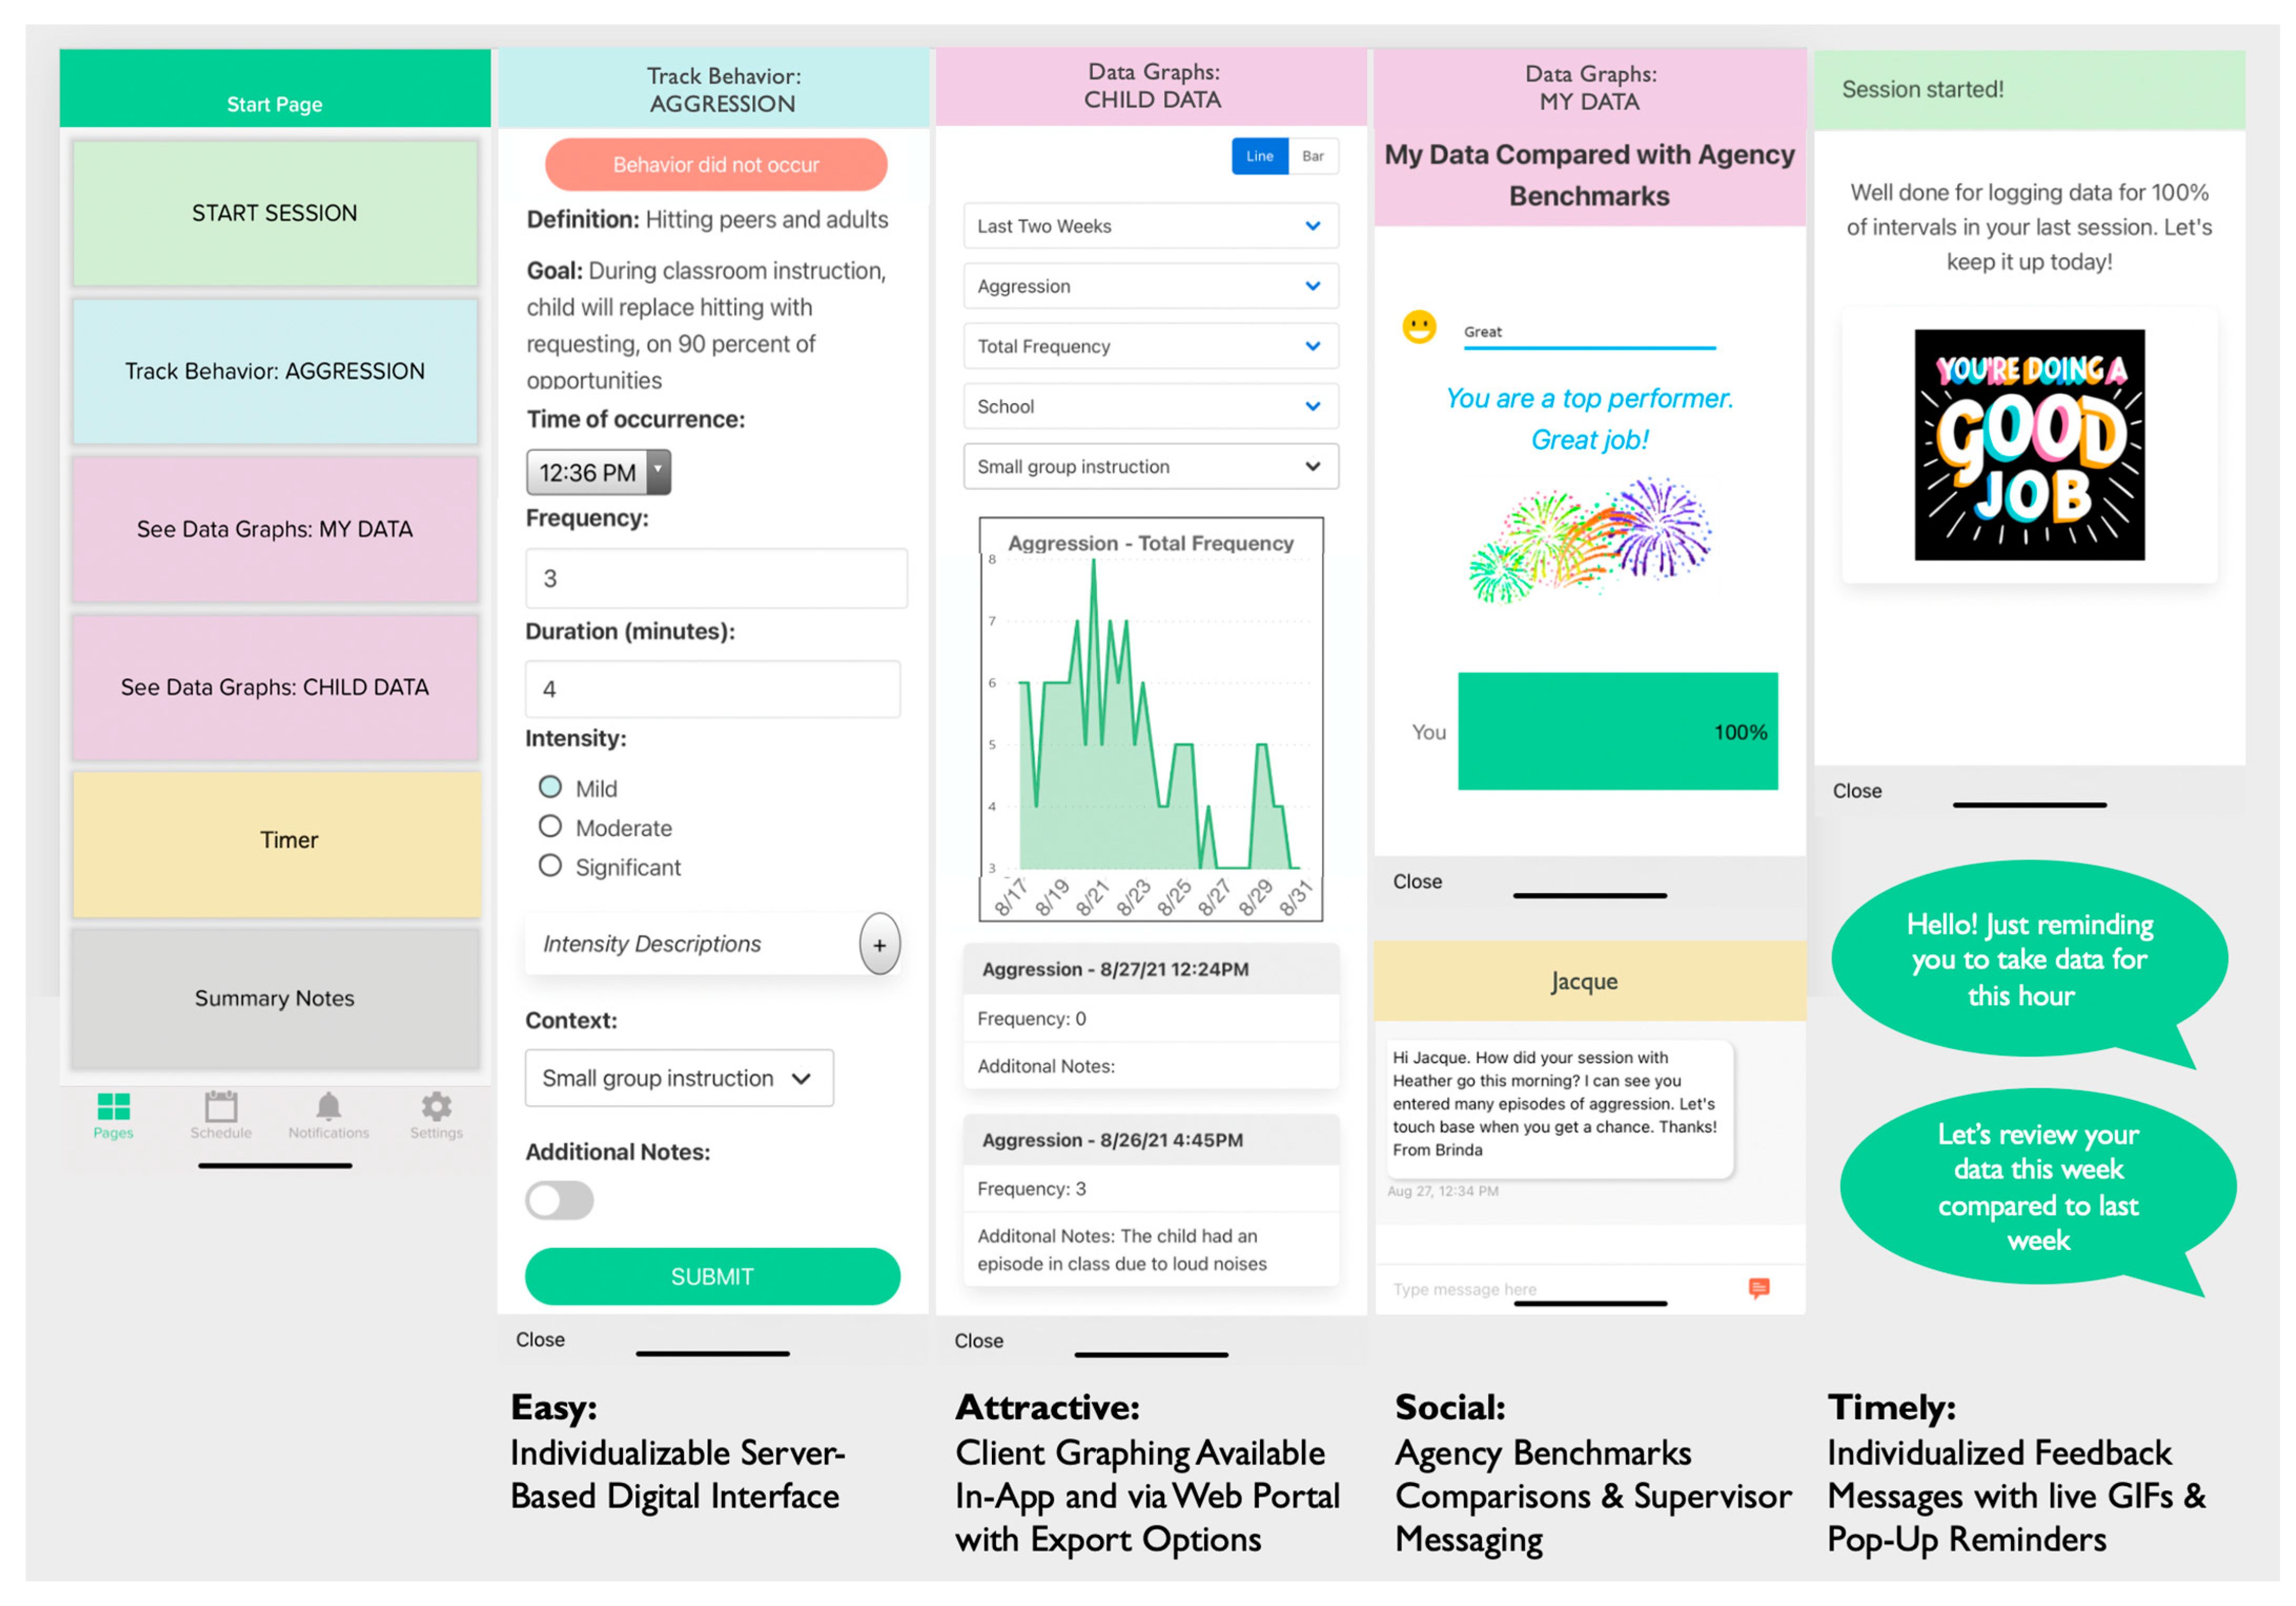
| Start Session | Start session, edit session length or end session early. Choose location (e.g., School, Home, Community, Daycare, Other). | Encouraging or celebratory feedback message upon starting a session, depending on whether their agency’s threshold of percentage of intervals data taken should be taken on was reached (e.g., “Well done for logging data for 100% of intervals in your last session. Let’s keep it up today!”). |
| Track Behavior/Skills Form | Behavior name, definition, and associated goal. Time behavior occurred (in case asynchronous data collected). Behavior metrics (chosen upon account set-up), including frequency, duration, intensity (three levels with editable descriptors), % opportunities and context. Additional notes. | Behavior did not occur quick button (as nudge to take absence of behavior data). In-session push notification reminders if data has not been collected during a time interval (e.g., at the end of the hour, interval set on account set-up): “Hello! Just reminding you to take data for this hour”. |
| See Data Graphs | Data graph of client’s behavioral data based on data entry, available on associated web platform. | Data graph of client’s behavioral data based on data entry, available in app and on associated web platform. Two data graph of one-to-one’s data entry (% of intervals data collected): (1) comparing the current week with the previous week with an encouraging or celebratory feedback message based on current this week’s data collection performance, and (2) comparing the current week with agency expectation threshold (% of intervals in which data should be taken), with encouraging (“Room for Improvement”) or celebratory feedback messages (“Good”, “Great”, “You are a top performer!”) and associated graphics (e.g., smiley faces, fireworks GIF). End of week (Friday, 4 p.m.) push notification reminders to check week-to-week comparison graphs: “Let’s review your data this week compared to last week”. |
| Summary Note | Free form text field, available once at least one quantitative behavior form has been entered during a session. | |
| Timer | Stopwatch timer to make it easier to collect behavior duration data. | |
| Messaging Platform | Basic messaging platform available via the app and/or associated web platform, which can be used for supervisor interaction. |
| Category | Participants | Improvement Idea/Feedback |
|---|---|---|
| Feature | Supervisors | Taking frequency and duration data by pushing a button in the app every time a behavior occurs. |
| Take duration of behavior using an app. | ||
| Positive messaging when taking data collection. | ||
| Include a visual of the data. | ||
| A recorder button to record a behavior when it occurs and takes duration data. | ||
| Take data on replacement behavior(s). | ||
| Make the app work with and without Wifi or cellular data. | ||
| Add a timer in the app. | ||
| Sync the app to determine reliability when support worker and supervisor are taking data. | ||
| One-to-one aides | Customizing the app with client behaviors. | |
| Make it simple to take data, such as clicking a + or − sign to indicate if a client exhibited a behavior. | ||
| Add a note section. | ||
| Customize the behavior, including the time interval per behavior. | ||
| A form or device to take data by pushing a button. | ||
| Include a list of behaviors to take data on in an app. | ||
| Include duration and intensity to take data on in an app. | ||
| Show visual data with a graph. | ||
| Add percentage option for frequency. | ||
| Take data in an app by including a button per behavior that you can click to take frequency. | ||
| Take data on a handheld device. | ||
| Take data in an app by including a button per behavior that you can click to take frequency and duration. | ||
| Add a note section. | ||
| User interface should be easy to use. | ||
| Take data on a phone app. | ||
| Add a timer in an app. | ||
| Take data on a device that does not require internet. | ||
| Have the option to record behaviors in real time. | ||
| Out of scope | Supervisors | Be able to record interventions and outcomes. |
| Be able to copy the data into electronic health record (EHR). | ||
| Be able to customize the app to match the format of the agency’s EHR. | ||
| Provide Wifi. | ||
| An interactive component to teach how to use the app (i.e., Clippy from Microsoft Word). | ||
| Be able to choose between frequency and partial interval data. | ||
| One-to-one aides | Record the data by using Bluetooth technology. | |
| Record the data by using a microphone. | ||
| Provide multiple different ways to take data through technology. | ||
| A clicker to record data for behaviors that happen frequently. | ||
| Be able to customize the app in real time (add behaviors). | ||
| Flow modification | Supervisors | Add a way to log multiple behaviors at once (for behaviors that often happen concurrently). |
| One-to-one aides | Add a way to log multiple behaviors at once (for behaviors that often happen concurrently). | |
| Remove the need to press the “close” button after submitting a behavior. | ||
| Out of scope | Supervisors | Tally button for each behavior on start page. |
| One-to-one aides | Tally button for each behavior on start page. | |
| Include the agency’s progress note form within the app. | ||
| Incorporate client facing features in the app (e.g., show the data graphs to show. progress and show positive messages on behalf of the client). |
| Cycle | Category | Participants | Improvement Idea/Feedback |
|---|---|---|---|
| Cycle 1 | New Feature | Supervisors | Line graph to visually display patterns in behavior. |
| Interval data collection form. | |||
| One-to-one aides | A function to compile individual notes at the end of the session. | ||
| Feature modification | Supervisors | Percentage of opportunities button in 10% increments. | |
| Numeric type-in option for frequency (type in number). | |||
| One-to-one aides | Numeric type-in option for frequency (type in number). | ||
| Flow modification | One-to-one aides | Remove “Behavior occurred” button. | |
| Out of scope | Supervisors | Link the app to the agency’s scheduler to make the app align with billing requirements. | |
| One-to-one aides | Intervention data collection tab. | ||
| E-sign the data submitted after each session. | |||
| Add behavior form section to captures outcome of behavior (mood/redirection/outcome). | |||
| Cycle 2 | New Feature | One-to-one aides | N/A |
| Feature modification | One-to-one aides | Reviewing data in the graphs by month would be more useful than by week. | |
| Wants more detailed description of the behaviors along with the goal description. | |||
| Only view one day’s worth of intervals in child data graph instead of multiple days at one time. | |||
| Have additional details fields (frequency, duration, etc.) pop up automatically after selecting “yes, behavior occurred”. | |||
| Include option in App to note that client “left early” or “no show”. | |||
| BHT has a super flexible schedule that changes frequently, so a “start” and “end” session button would be useful instead of having a set schedule. | |||
| Flow modification | One-to-one aides | N/A | |
| Out of scope | One-to-one aides | Include a component in the app that the child can engage with. | |
| Include a way to track antecedents and interventions. | |||
| Have the app match the one-to-one aides’ data sheet identically. | |||
| Cycle 3 | New Feature | Supervisors | Add a method to easily take note of the absence of a behavior. |
| One-to-one aides | N/A | ||
| Feature modification | Supervisors | Timer button on start page. | |
| Add the option to specify location (home, daycare, school, community) since some kids receive service in multiple locations. | |||
| Change “significant” to “severe” when describing levels of severity. | |||
| Make the severity definitions appear before a BHT selects a severity level option (e.g., “expand all definitions” option, “view definitions” option). | |||
| Change % of opportunity to be a drop down where user can input # of successful opportunities and total # opportunities. | |||
| Add option on behavior form to add context (e.g., whole class instruction, 1:1, option to edit list). | |||
| Change client data graph to be line graph instead of bar graph. | |||
| One-to-one aides | On Start Page, have option to manually enter the exact start time. | ||
| Opportunity to record more behaviors, specifically the positive behaviors. | |||
| Make the app compile the notes from the behavior forms and summary note(s) together into one compilation of notes at the end of a session. | |||
| Add a button you can push that says the behavior did not occur. |
Publisher’s Note: MDPI stays neutral with regard to jurisdictional claims in published maps and institutional affiliations. |
© 2022 by the authors. Licensee MDPI, Basel, Switzerland. This article is an open access article distributed under the terms and conditions of the Creative Commons Attribution (CC BY) license (https://creativecommons.org/licenses/by/4.0/).
Share and Cite
Nuske, H.J.; Buck, J.E.; Ramesh, B.; Becker-Haimes, E.M.; Zentgraf, K.; Mandell, D.S. Making Progress Monitoring Easier and More Motivating: Developing a Client Data Collection App Incorporating User-Centered Design and Behavioral Economics Insights. Soc. Sci. 2022, 11, 106. https://doi.org/10.3390/socsci11030106
Nuske HJ, Buck JE, Ramesh B, Becker-Haimes EM, Zentgraf K, Mandell DS. Making Progress Monitoring Easier and More Motivating: Developing a Client Data Collection App Incorporating User-Centered Design and Behavioral Economics Insights. Social Sciences. 2022; 11(3):106. https://doi.org/10.3390/socsci11030106
Chicago/Turabian StyleNuske, Heather J., Jacqueline E. Buck, Brinda Ramesh, Emily M. Becker-Haimes, Kelly Zentgraf, and David S. Mandell. 2022. "Making Progress Monitoring Easier and More Motivating: Developing a Client Data Collection App Incorporating User-Centered Design and Behavioral Economics Insights" Social Sciences 11, no. 3: 106. https://doi.org/10.3390/socsci11030106